Dashboard for High Rises
Published on 30 Dec 2023 by Emma Eynon
SkySpark visualisations for energy performance in high rise buildings
Client brief
Our client provides energy performance services for a portfolio of high rise buildings. They approached us to create a suite of sophisticated visualisations for SkySpark data.
The main aim of these visualisations was to provide easy access to key data for building owners and tenants. There was an extensive range of visualisation and data requirements which was broken down into iterative project developments.
The client provided a full suite of professionally designed visualisations to replicate and a detailed list of data requirements for these displays.
Our task was to translate how these designs and requirements could be accommodated for, and even improved on, with SkySpark.
Note: This project has evolved over a number of stages and the software has been released as a commercial product. For our client's business requirements, we built these SkySpark views within a bespoke web application hosted in Fantom website, connecting to SkySpark for all the data. This article displays the same styling within the SkySpark application instead.
Dashboard Requirements
Audience | Building owners and tenants. |
Data use | Monitoring, performance, fault detection, and energy analytics. |
Visuals | Stunning and sophisticated, replicating the client's graphic designs. |
Experience | To provide a smooth high-end experience of accessing the data. |
Design considerations
To replicate sophisticated graphic designs as closely as possible over 5 view screens.
Using custom made SVG files (Scalable Vector Graphics) for better image performance.
A bespoke theme with background imagery and tailored clickable actions.
A boxed and shadowed tiled effect for page layouts.
A tailored colour range building on the traffic light system to help indicate performance.
Optimised for different screen sizes and including a specific kiosk mode for displaying data in lobby and reception areas on large screens.
Build tasks
For this project our tasks involved:
- Custom SVGs for high resolution images
- Full frontend Fantom-based web application creation
- Integration with SkySpark via API calls using Weblets
- Assisting with writing Axon functions for gathering and formatting data for display
- Assisting with data cleansing for quality improvements
Deployment
We (Fantom Factory) built the dashboard in iterative stages for each widget, testing against a comprehensive sample of SkySpark data.
Image gallery
Client feedback
Our client was amazed that we were able to replicate their designs EXACTLY. They loved how we did all the heavy lifting for them and involved them at all the right stages for testing and feedback.
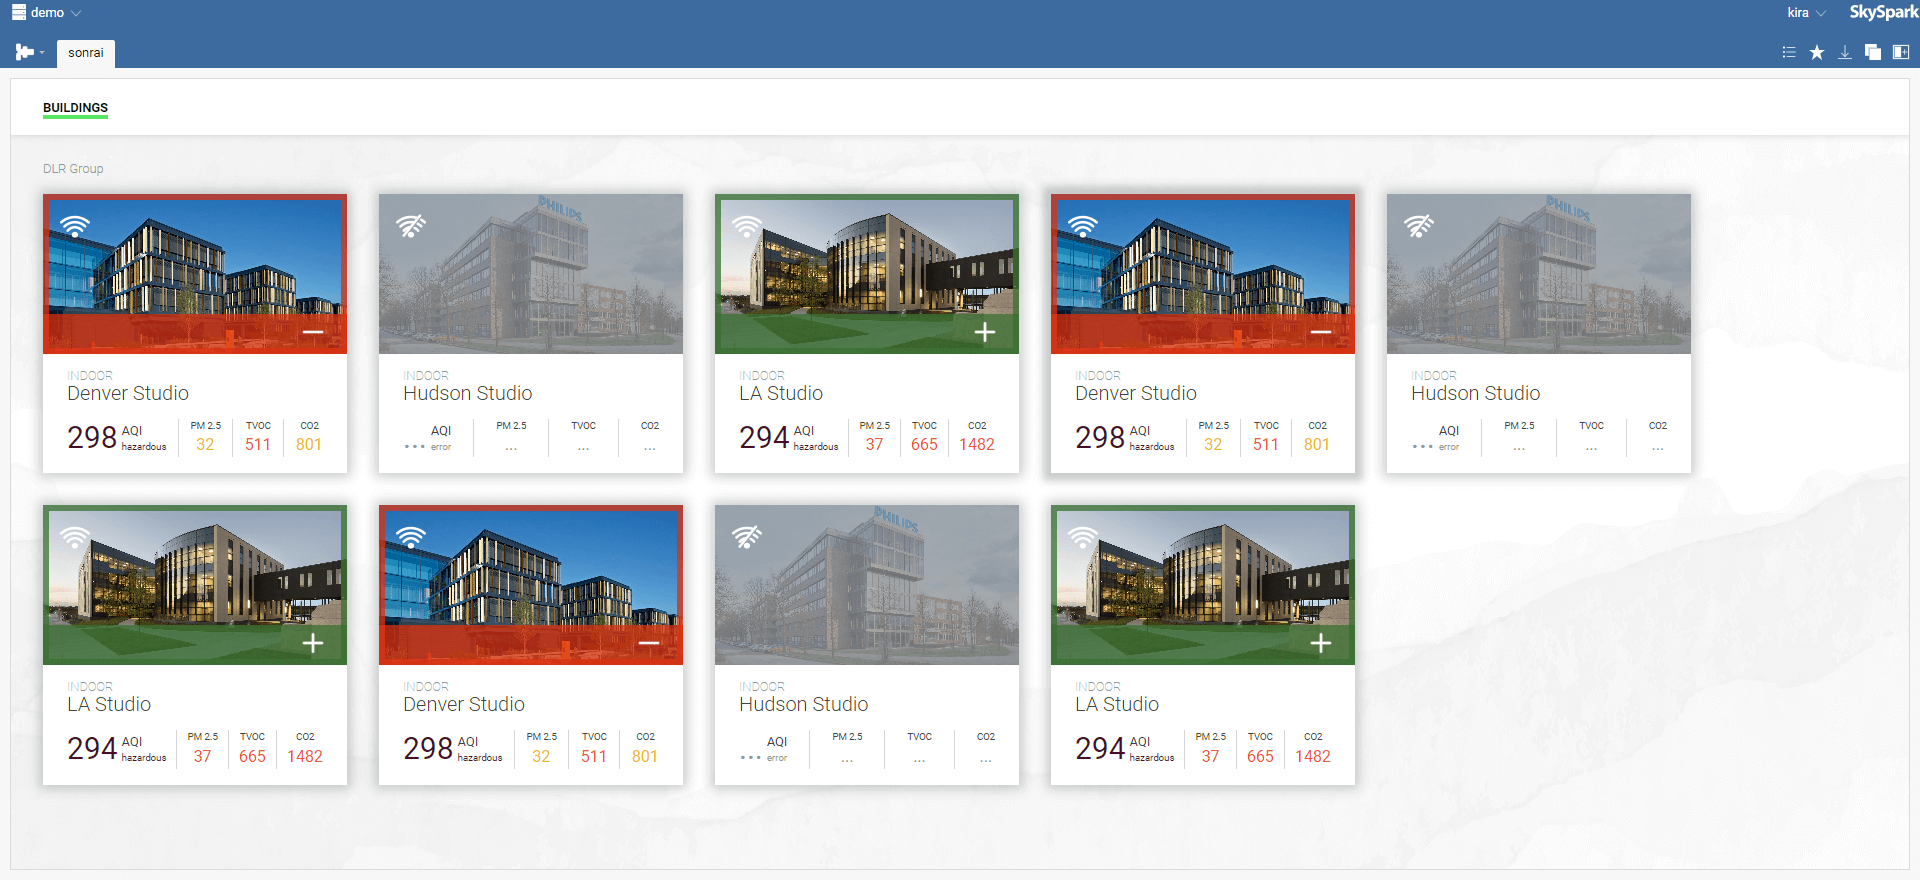
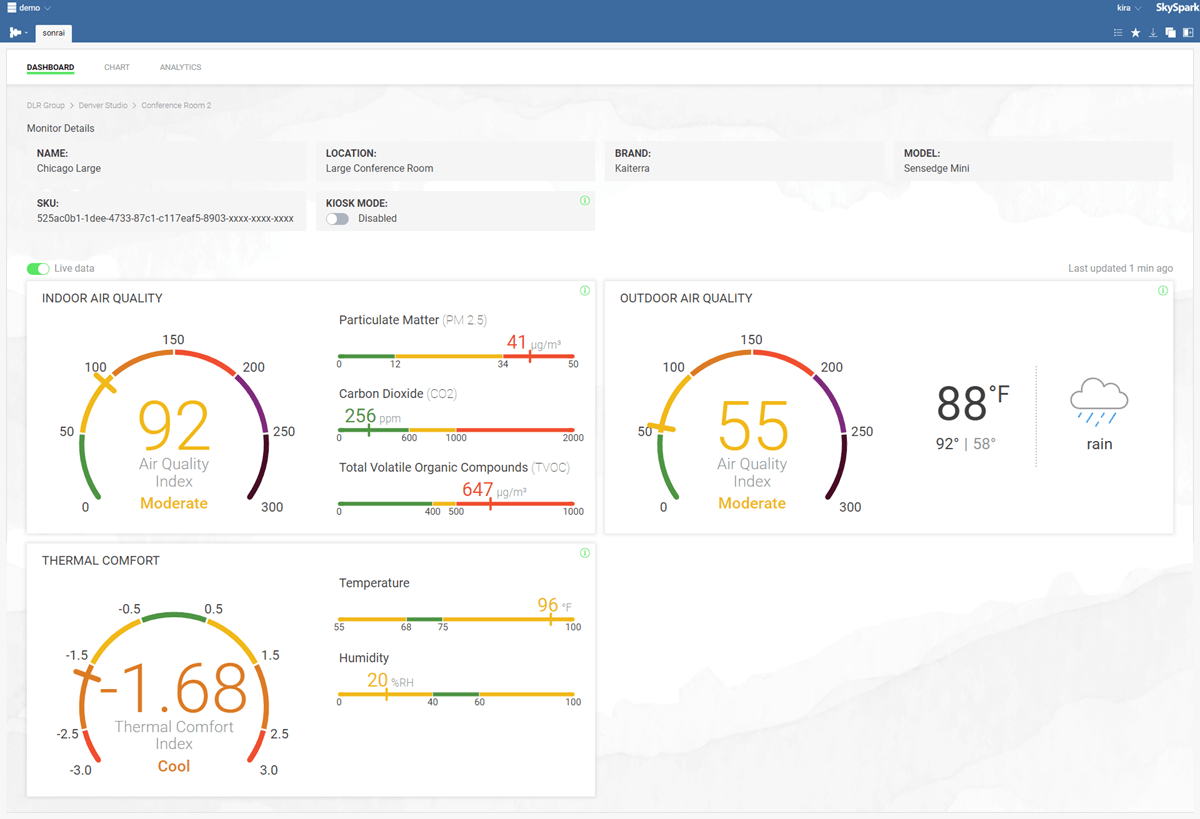
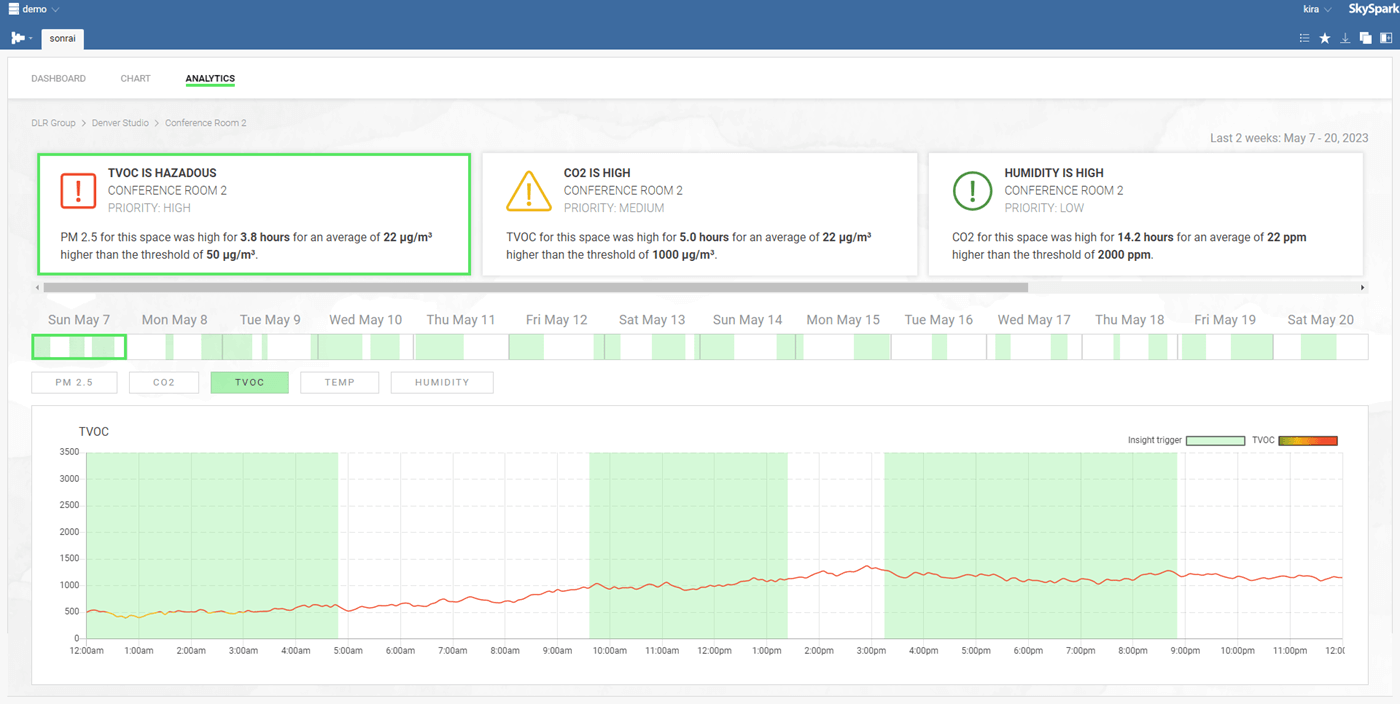
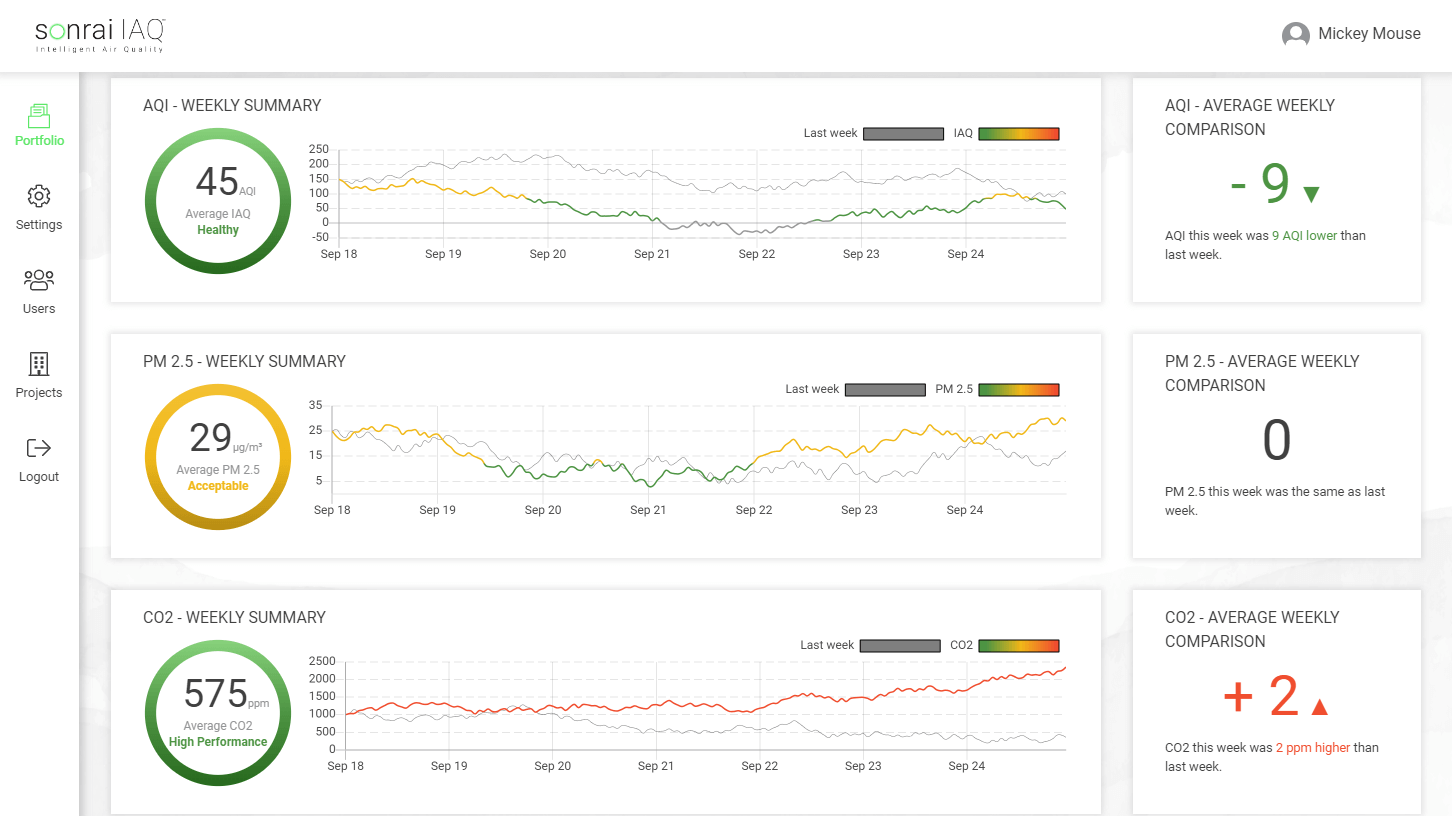
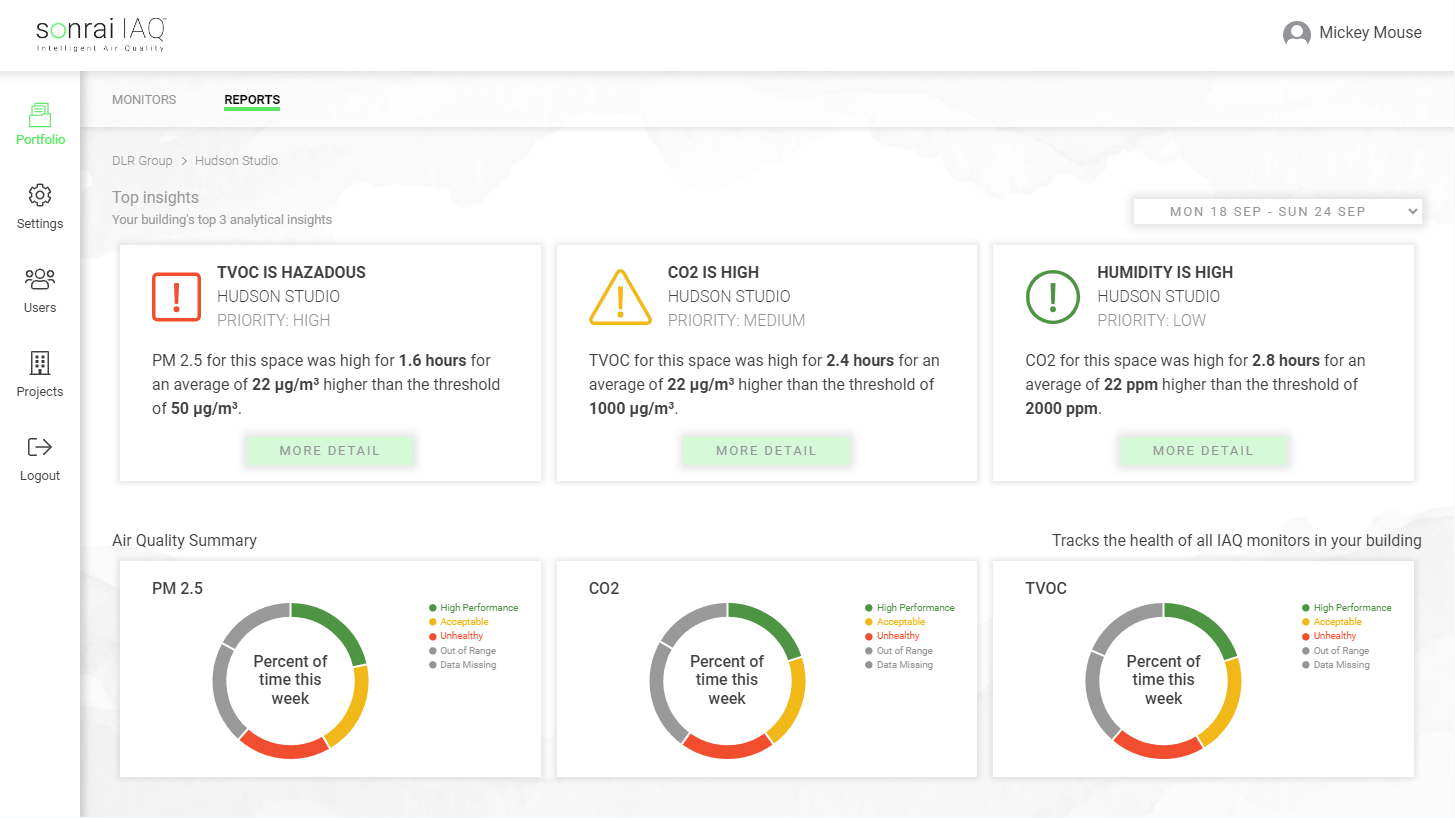
Dashboard Sparkles
See how the colours and icons change with data variances in the final result:
Further reading
Our approach to dashboards.