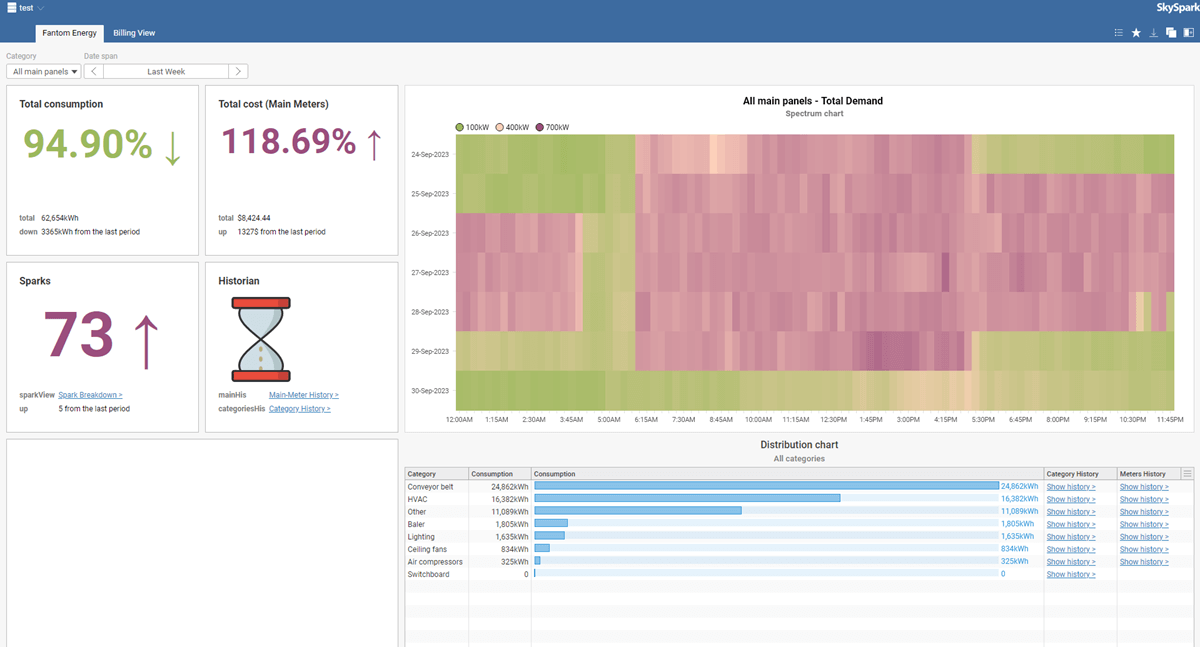
Dashboard for Warehouses
Published on 28 Dec 2023 by Emma Eynon
A SkySpark dashboard for warehouse energy data.
Client brief
Our client provides energy system services to a large warehouse user. They wanted an easy to use dashboard to prove the breakdown of building energy performance data and cost.
Dashboard Requirements
Audience | Warehouse engineering monitoring team and executives. |
Data use | Analytics for energy performance. |
Visuals | Using native SkySpark visuals with additional styling for easy reading. |
Experience | To provide easy access to key SkySpark data with a native feel. |
Design considerations
SkySpark cards and icons were employed for a native experience.
A date picker option to select historical date ranges.
The most important widgets were:
- the customised heatmap to show hourly cost,
- and an accompanying table containing bar cells to categorise the energy consumption for a selected period.
A light theme to match the default SkySpark theming and provide a similar experience.
Green and red colours were used to highlight a positive or negative performance.
Links and embedded apps provide a means to navigate further into SkySpark easily.
A boxed tile format assists with "at-a-glance" reading for each data section.
Optimised for different screen sizes.
Deployment
We (Fantom Factory) built the dashboard in iterative stages for each widget, testing against a comprehensive sample of SkySpark data.
The dashboard is delivered to the client as a .pod file which they can install as a simple SkySpark extension.
After testing each deliverable on their development SkySpark server, we were happy to release the final version in exactly the same way.
- Delivered SkySpark extensions can be easily installed.
- .pod files are accessible for the client to read the dashboard source code.
- Axon functions within the extension can be amended by the client to change data displays.
- The SkySpark extension can be rebuilt and developed further for more features and changes.
Client feedback
This dashboard has been instrumental in changing their customer perception of energy use. More informed (and more effective) decisions have now been made on energy-saving practices saving the customer a great deal of money.
Our client is very happy with this end result and enjoyed the whole experience of working with our team.
We are pleased to say our client has engaged us on a new project to provide energy billing information in PDF reports to another of their customers.

