Dashboard for Hospitals
Published on 27 Dec 2023 by Emma Eynon
SkySpark Visualisations for key hospital performance data and operations.
Client brief
Our client provides energy system services to a number of hospital campuses using SkySpark. They wanted to prove key performance data to key members of staff at each hospital without a need for in-depth SkySpark training.
Our client approached us to create a suite of easy to use SkySpark visualisations to present to hospital executives and project managers.
To use the same Views across multiple sites, they needed to accommodate for differences between individual hospital installations.
It was important to our client that they could change details on these views internally with Axon, such as site information and branding, and some widgets and data.
Dashboard Requirements
Audience | Hospital executives and project managers. |
Data use | Analytics for energy performance and remote monitoring. |
Visuals | Using native SkySpark visuals with additional styling for easy reading. |
Experience | To provide easy access to key SkySpark data with a native feel. |
Design considerations
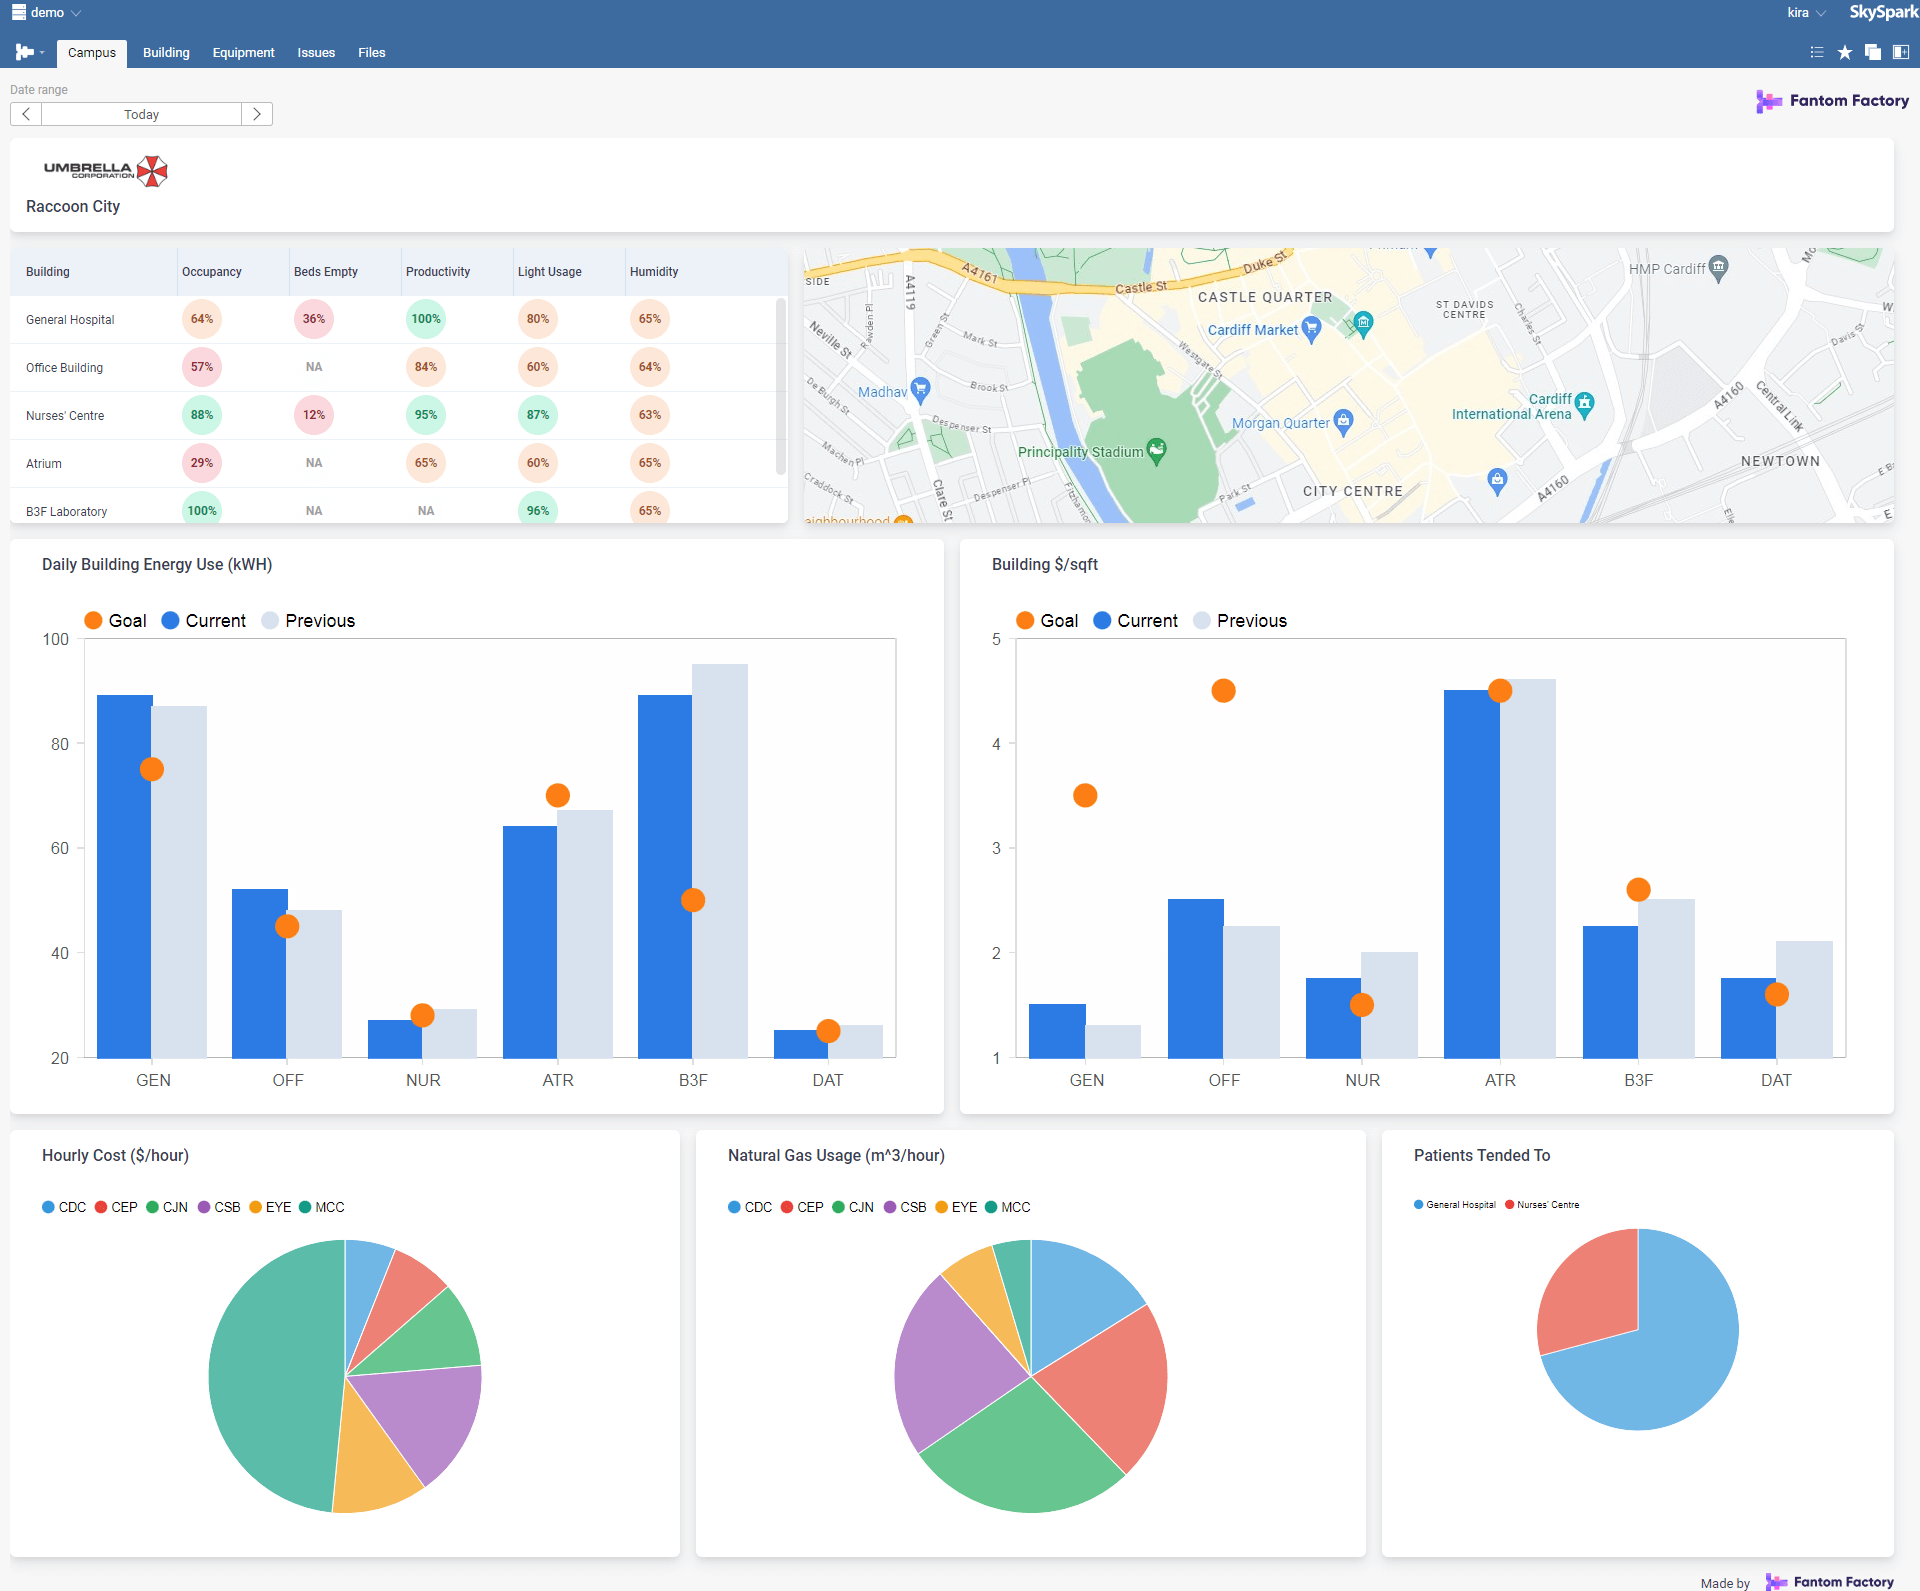
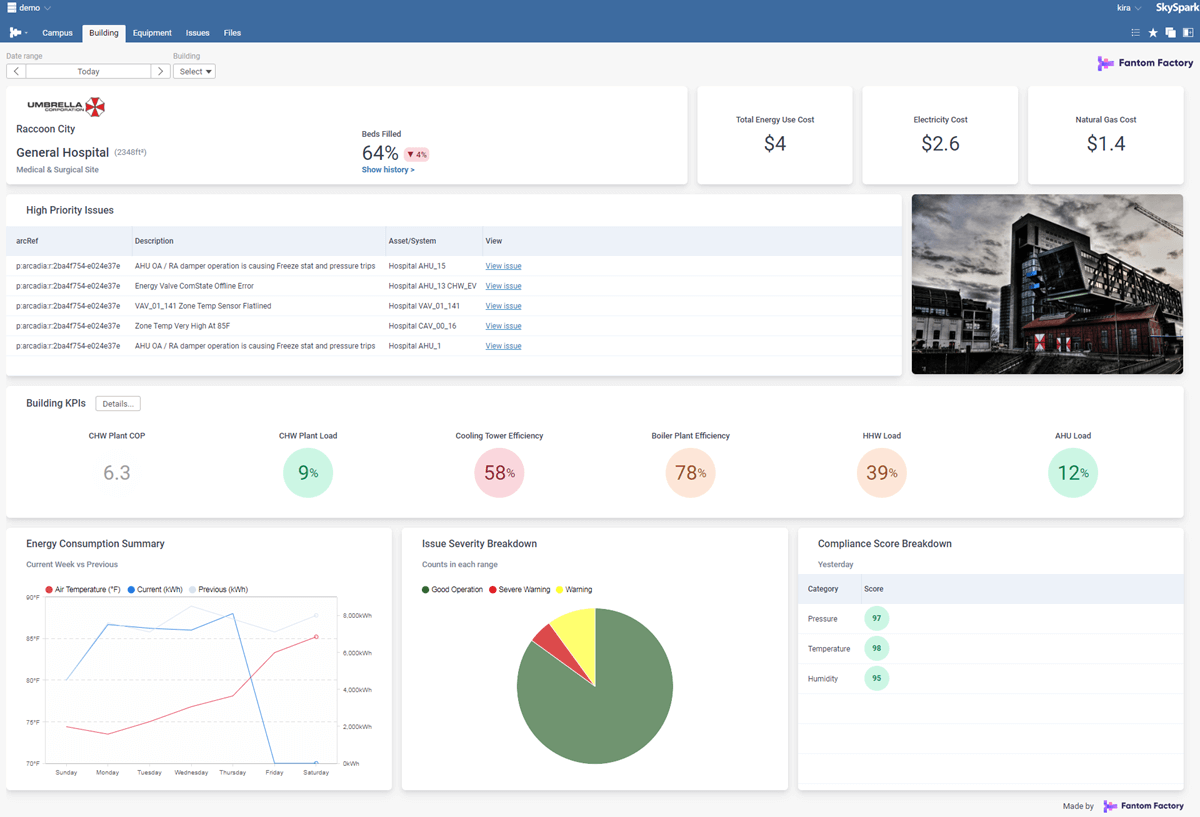
A suite of 5 views were created to help break down data into a hierarchy of information for hospital sites: Campus, Building, Equipment, Issues, and a hosted Files view.
Customisable site information and branding and View data with Axon code.
A date picker option to select historical date ranges.
A light theme to match the default SkySpark theming and provide a similar experience.
Space for branding and site information without interfering with the data visualisations.
Traffic light colours were used to add additional highlights to key performance data.
Links and embedded apps provide a means to navigate further into SkySpark easily.
A boxed tile format assists with "at-a-glance" reading for each data section. The tiles were given rounded corners and shadows to help break up the tile sections.
Optimised for different screen sizes.
Build tasks
For this project our tasks involved:
- Suite of stub Axon functions to display placeholder data in views.
- Assistance with writing the implementation-level Axon functions for collecting and formatting data for presentation.
- Creation of bespoke Fantom-based view layouts that implement data from Axon functions.
- Implementation of a top-level view that utilises the built-in SkySpark Arc view as a sub view.
Deployment
We (Fantom Factory) built the dashboard in iterative stages for each widget and completed view, testing against a comprehensive sample of SkySpark data.
The dashboard is delivered to the client as a .pod file which they can install as a simple SkySpark extension.
After testing each deliverable on their development SkySpark server, we were happy to release the final version in exactly the same way.
- Delivered SkySpark extensions can be easily installed.
- Axon functions within the extension can be amended by the client to change data displays.
- The SkySpark extension can be rebuilt and developed further for more features and changes.
Client feedback
Our client really enjoyed the experience of working with us and spending time on video calls to shape the direction of this project in the way they wanted.
We accommodated all of their design requirements and the end result was more visually pleasing than they had originally expected it would be.
These views have improved working relationships with their customers and are now easily supported in their internal team. We look forward to working with them again in the near future.
Further reading
Our approach to dashboards.