Dashboard for Data Centres
Published on 26 Dec 2023 by Emma Eynon
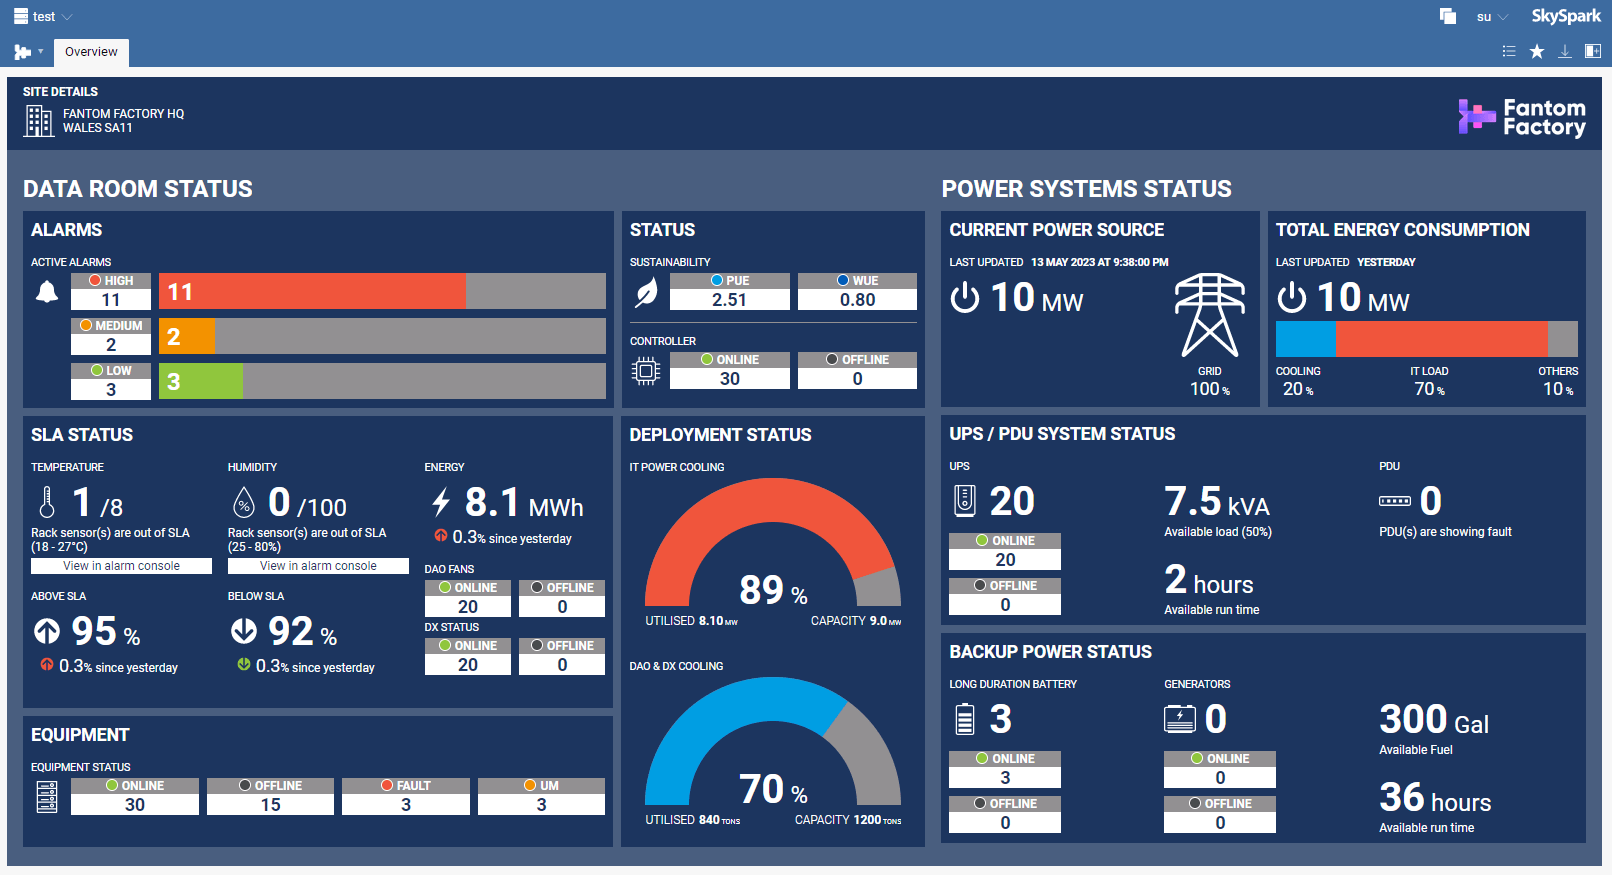
A SkySpark Dashboard to monitor data centre building operations.
Client brief
Our client approached us to create a visually impressive dashboard for monitoring data centres. The client constructs and leases data centres to customers who then need to manage the sites internally.
This dashboard would be a utility to help their customers more easily monitor the building operations and alerts with SkySpark data.
Addtionally, they desired this dashboard to impress customers and to visually compete alongside other leading brand technology displays on large screens in an IT control centre.
Also, this dashboard was intended to be a Proof of Concept to promote the adoption of SkySpark systems into more customer data centres for analytics.
Dashboard Requirements
Audience | Data centre engineering monitoring team and executives. |
Data use | Real-time daily monitoring for critical systems in a data centre. |
Visuals | Impressive at-a-glance graphics with a high-end feel. |
Experience | To be easily accessed as a SkySpark application. |
Design considerations
We worked with the client to replicate their own provided graphic designs.
A dark theme for use in the IT control centre making this dashboard visually different from typical white screens and thus more appealing.
Space for branding and site information without interfering with the data visualisations.
Bright colours were favoured to indicate urgency via a traffic light system of red, yellow, and green. Blue was also used to help read data more easily between different graphs and charts.
Subtle hyperlinks to navigate to further details on alarms rather than try to show too much information on this dashboard.
A boxed tile format assists with "at-a-glance" reading for each data section.
Custom icons to draw the eye to temperature, humidity, and energy. All graphics were custom made by Fantom Factory as optimised SVG files (Scalable Vector Graphics) to keep a high quality on different screen sizes.
A clear design to show the difference between NUMBERS of equips and alarms and NUMBERS displayed in the point data.
Optimised for different screen sizes to show this on a large control centre screen and on the smaller sized mobiles and tablets for engineers on site.
Build tasks
For this project our tasks involved:
- Custom SVGs for high resolution images
- Axon function and rule writing
- A full suite of Fantom-based views, including several bespoke data visualisation types.
Deployment
We (Fantom Factory) built the dashboard in iterative stages for each widget, testing against a comprehensive sample of SkySpark data.
The dashboard is delivered to the client as a .pod file which they can install as a simple SkySpark extension.
After testing each deliverable on their development SkySpark server, we were happy to release the final version in exactly the same way.
- Delivered SkySpark extensions can be easily installed.
- Axon functions within the extension can be amended by the client to change data displays.
- The SkySpark extension can be rebuilt and developed further for more features and changes.
Client feedback
The feedback was very positive from our client who enjoyed how smooth the whole process was.
After providing the initial designs and requirements, they provided feedback and change requests throughout the build phase to shape the end product they desired.
They were involved at all stages to understand timelines and progression.
The project was delivered as a pleasant experience and faster than expected.
As a result, we exceeded their expectations on the brief and they are now looking to develop larger SkySpark projects and dashboards with us.
Dashboard Sparkles
See how the colours and icons change with data variances in the final result:
Further reading
Our approach to dashboards.