SkySpark Dashboards - why?
Published on 01 Sep 2023 by Emma Eynon
SkySpark dashboards are in demand - more than ever before. But why?
In this article, we'd like to share our thoughts on this topic and some ways to ensure you make the most of your time - and money!
What are SkySpark dashboards?
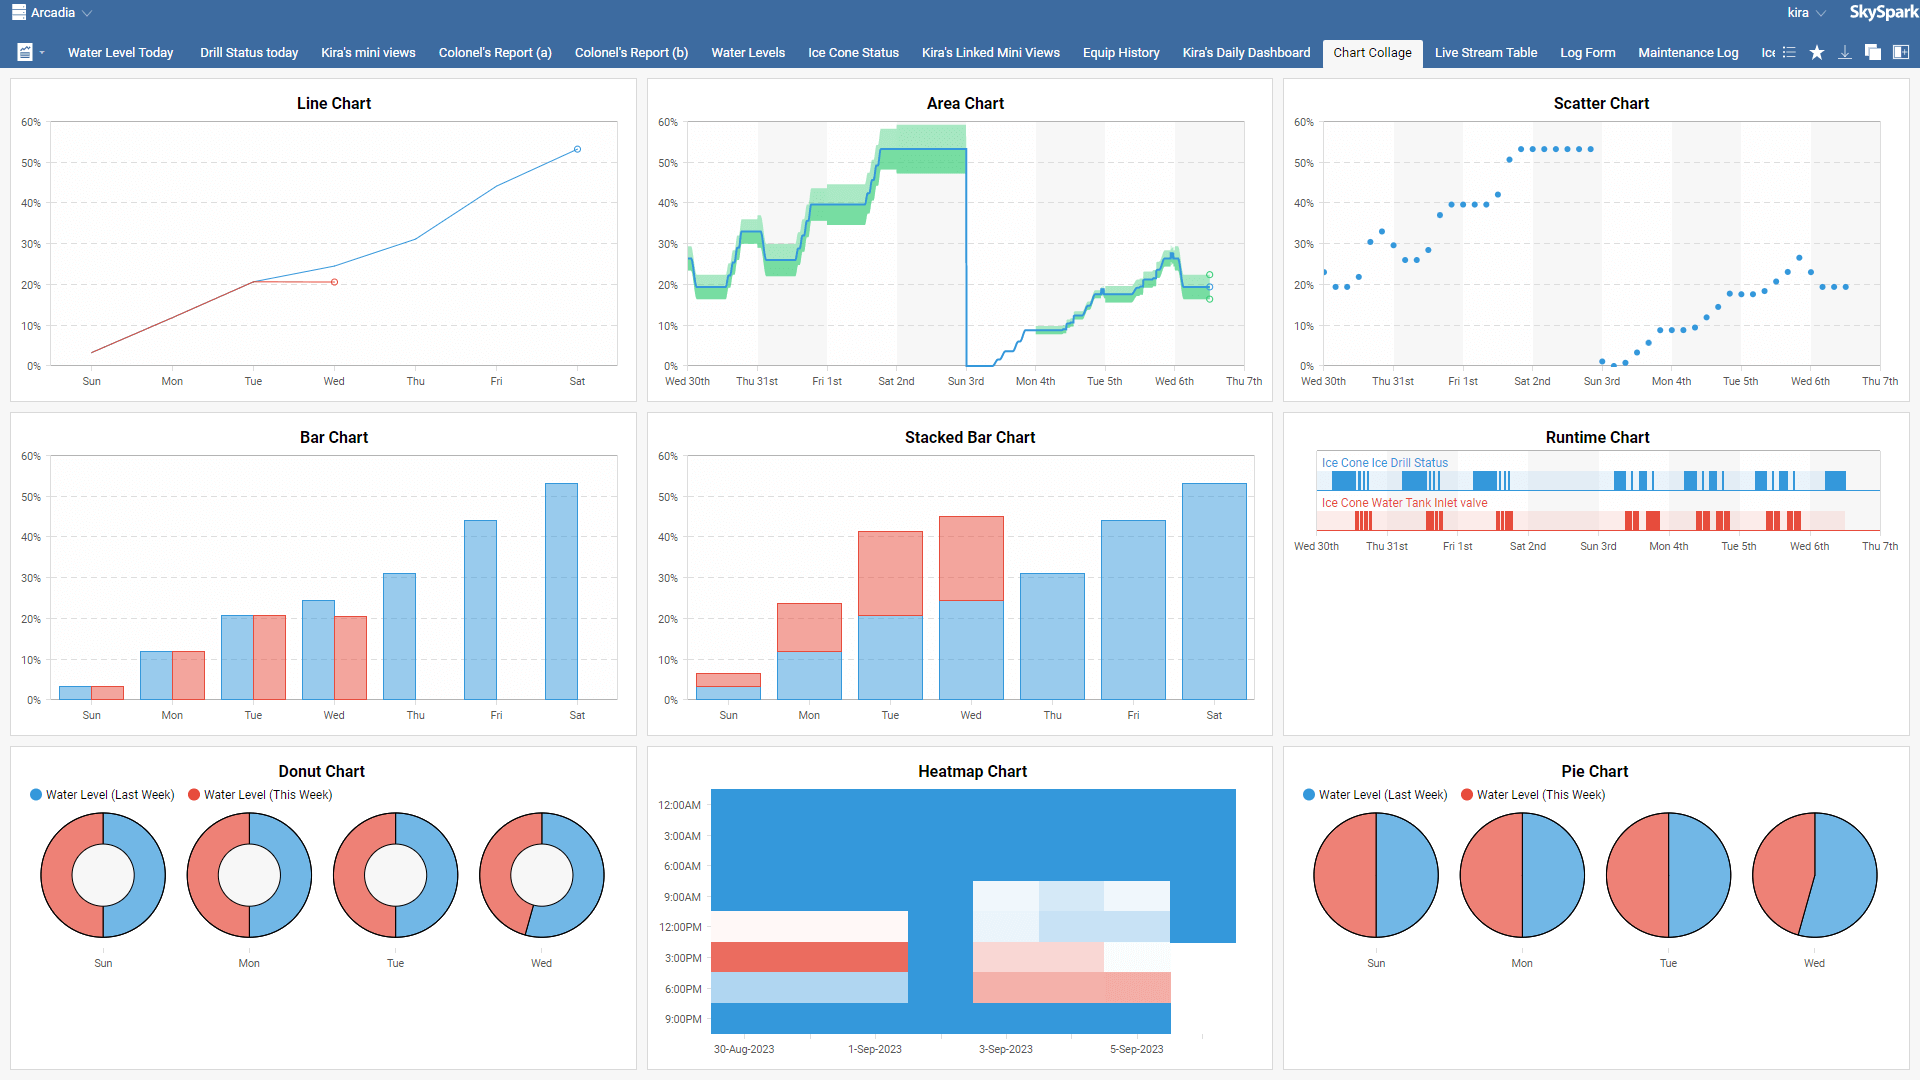
As you may already be aware, SkySpark is a data analytics platform which has many native applications and display options to show your data in all the salient ways.
We can do this with the Historian, Monitor, KPI, Spark, and Energy applications - "out of the box".
SkySpark is built for large data sets, which can handle incredibly large buildings and sites. However, this can also mean a lot of data on your screen!
So, a dashboard is an easy way to look at your hot picks of data.
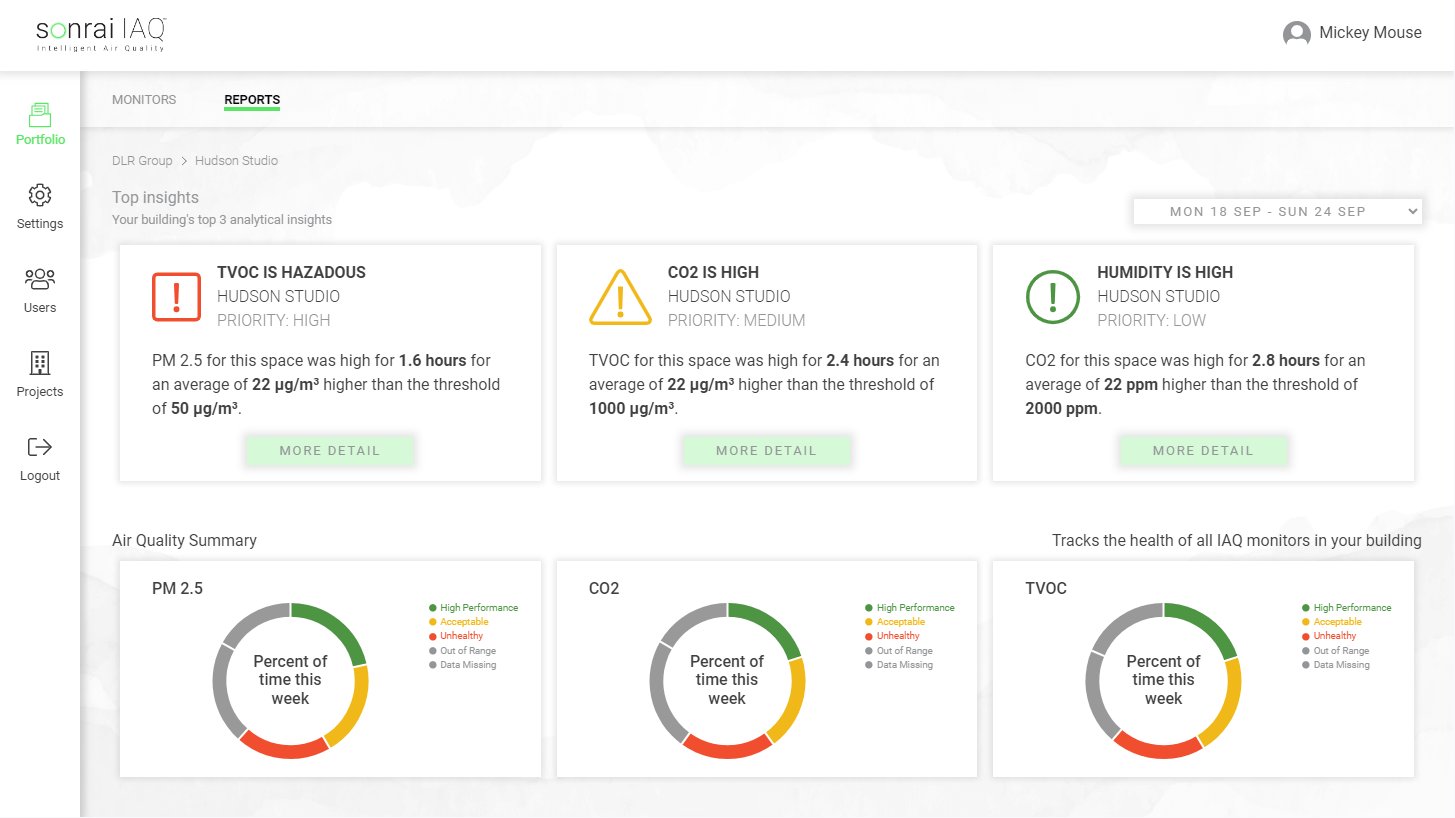
Some examples
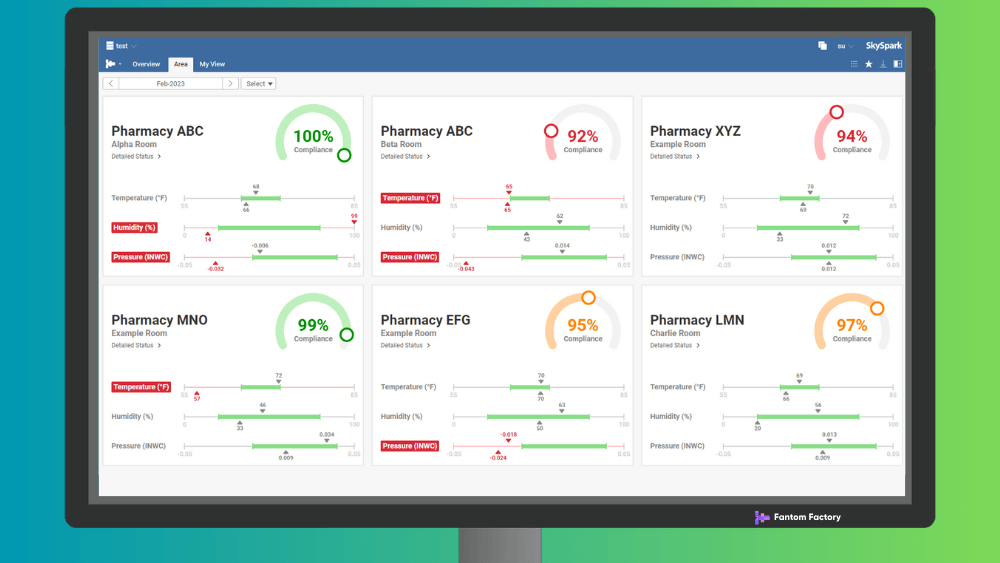
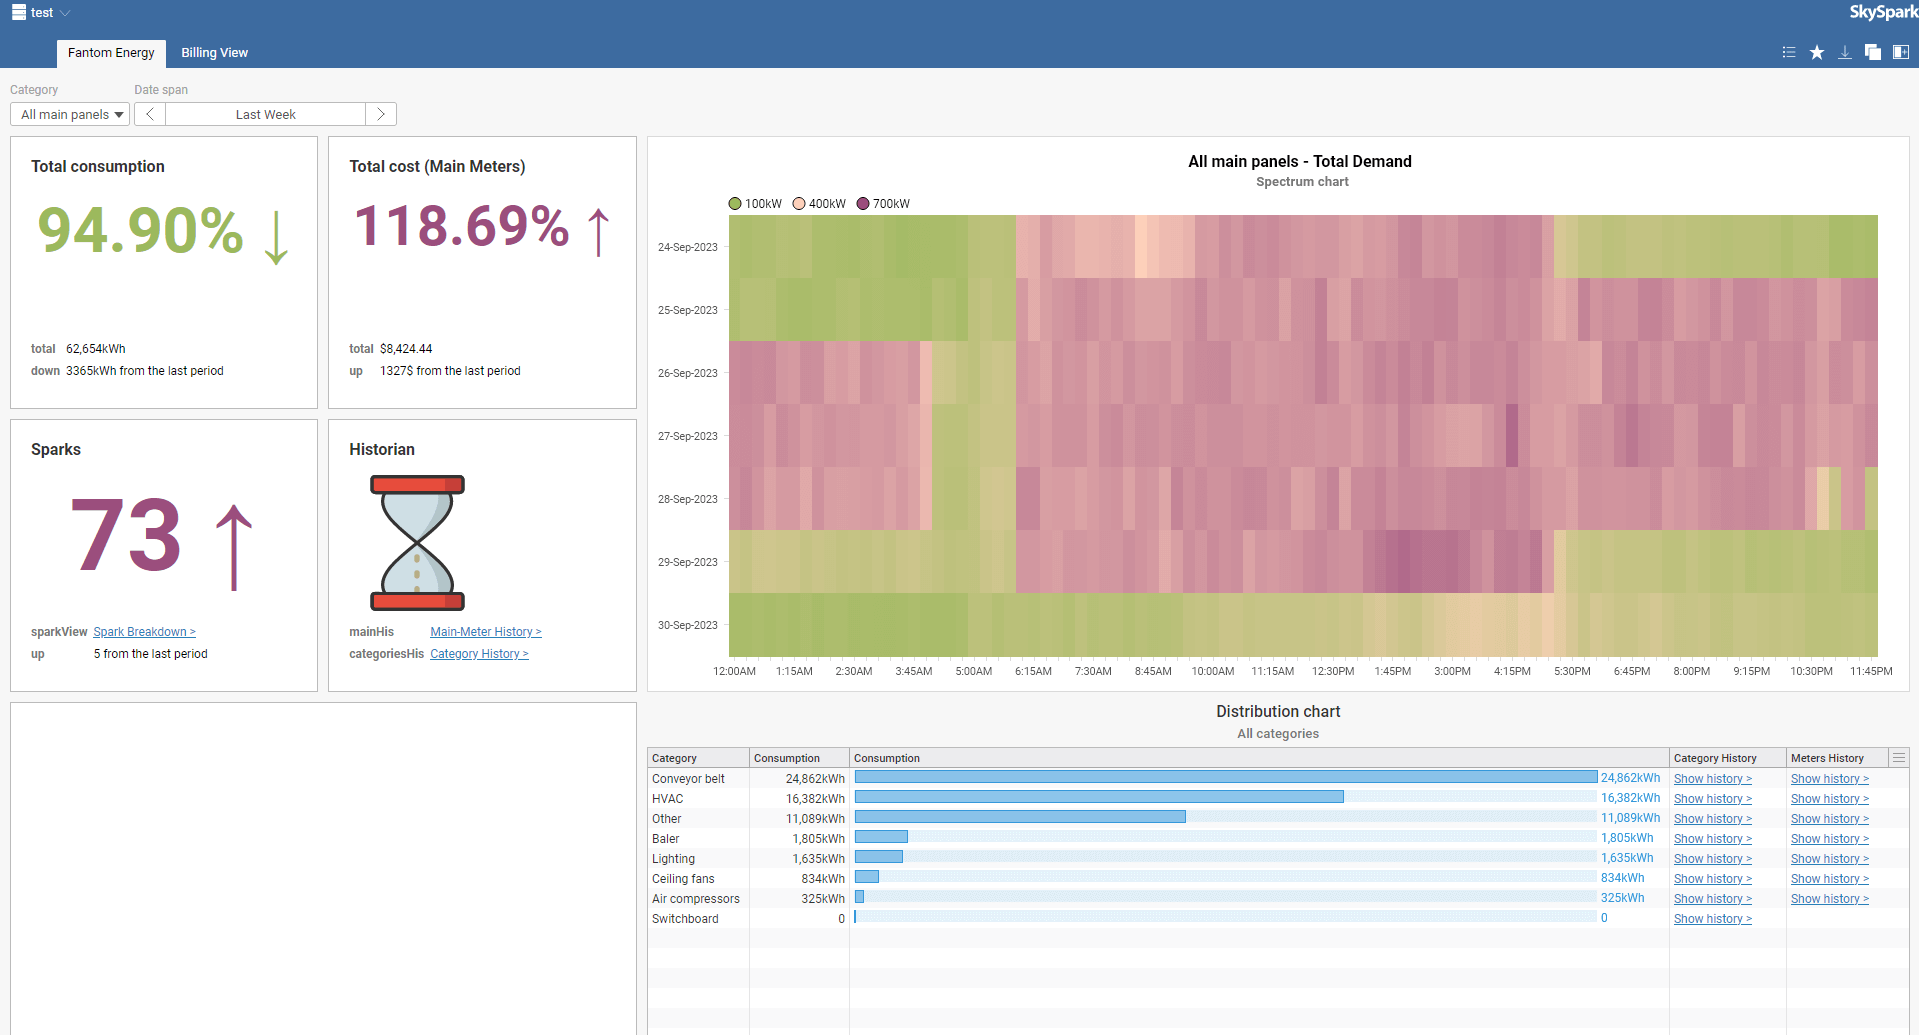
- Personalise graphics to display metrics like room temperature or occupancy?
- Showcase something good, like the air quality score in a work space?
- Compare reporting data online, perhaps monthly energy costs?
The fantastic thing about SkySpark is in how customisable it is, showing you any slice of your data you want to see. The difficulty is in presenting the uniqueness of your data in a way that is personalised to your business!
A dashboard is a uniquely personalised visual display in SkySpark which saves time and effort of drilling through large data sets.
SkySpark Viewbuilder
SkySpark offers a "viewbuilder" feature to create your own SkySpark screens. Choose from a range of layouts, graphical displays, and filter options to display the data you need onto a personalised screen.
To do this, you will need some Axon programming knowledge and some training - which you would need to have in your SkySpark team anyway!
In fact, there are so many view building options to choose from we created a whole eLearning course about it!
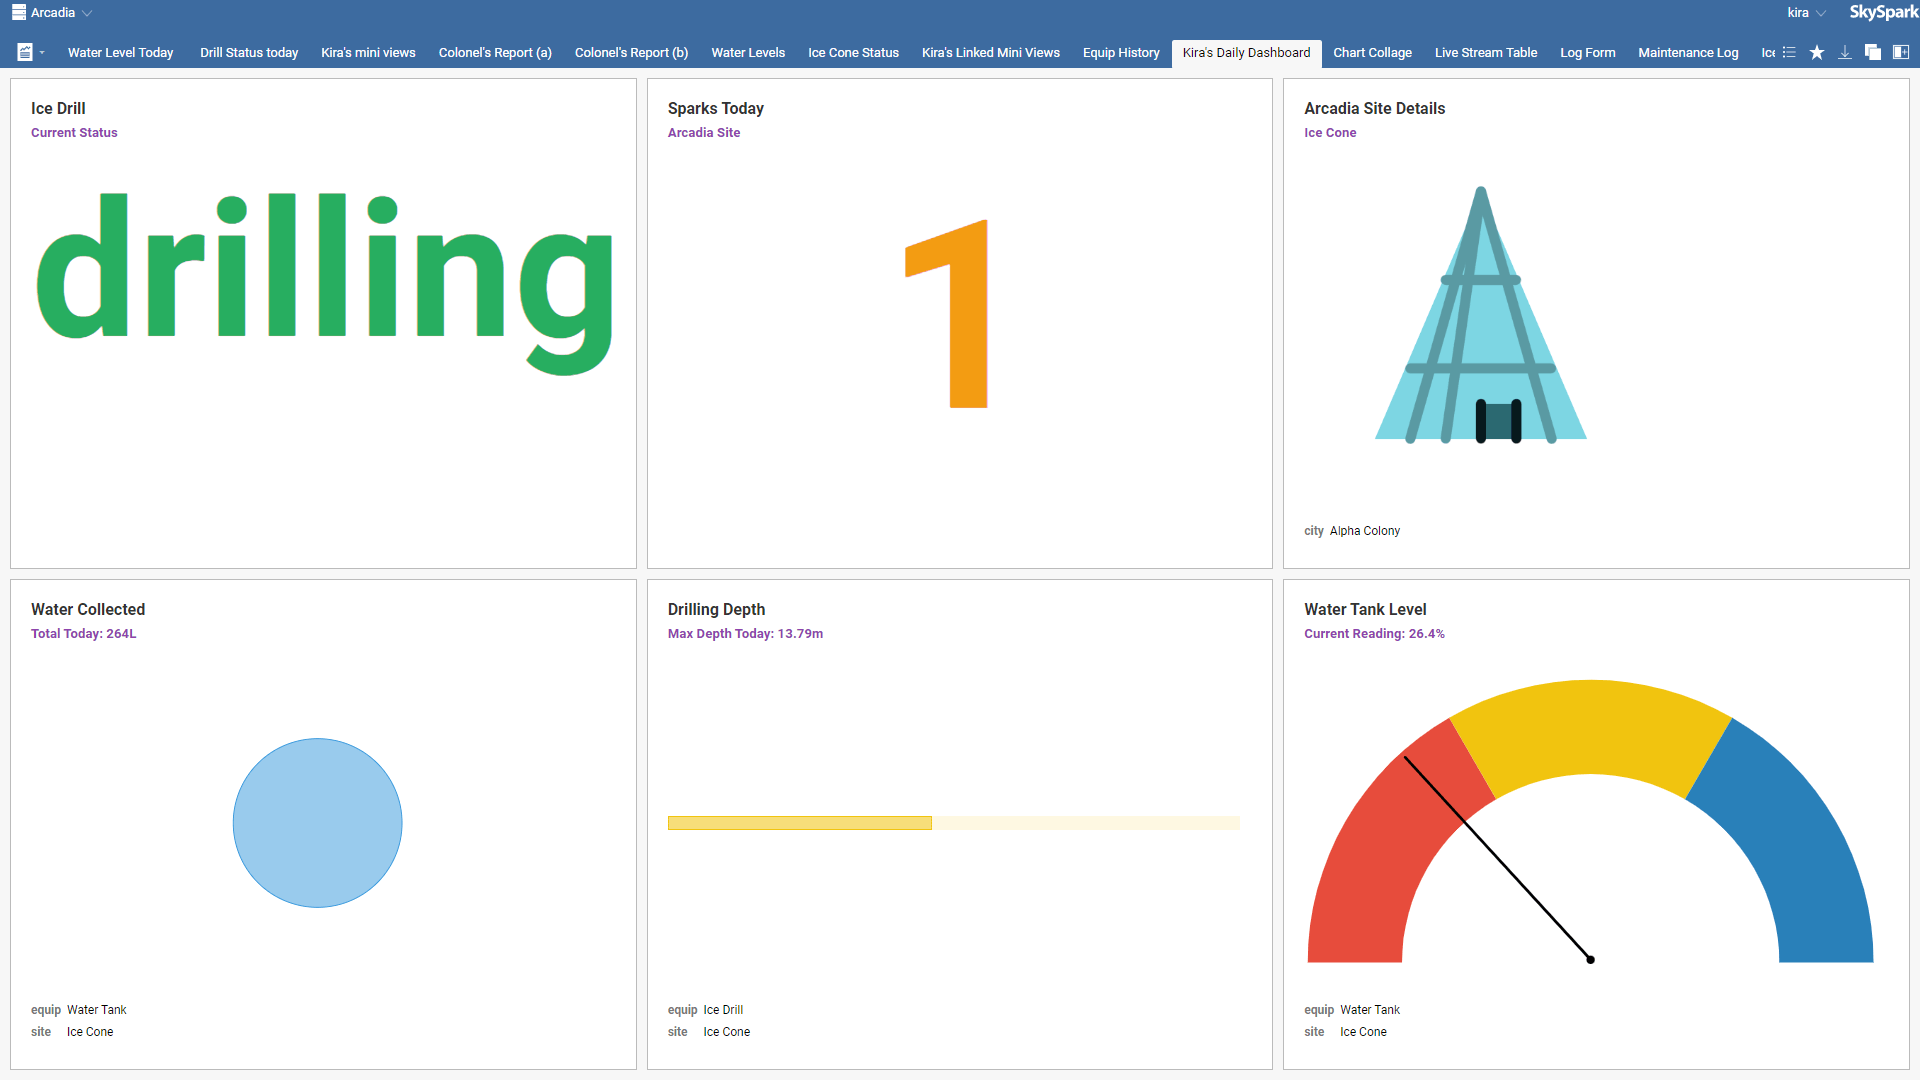
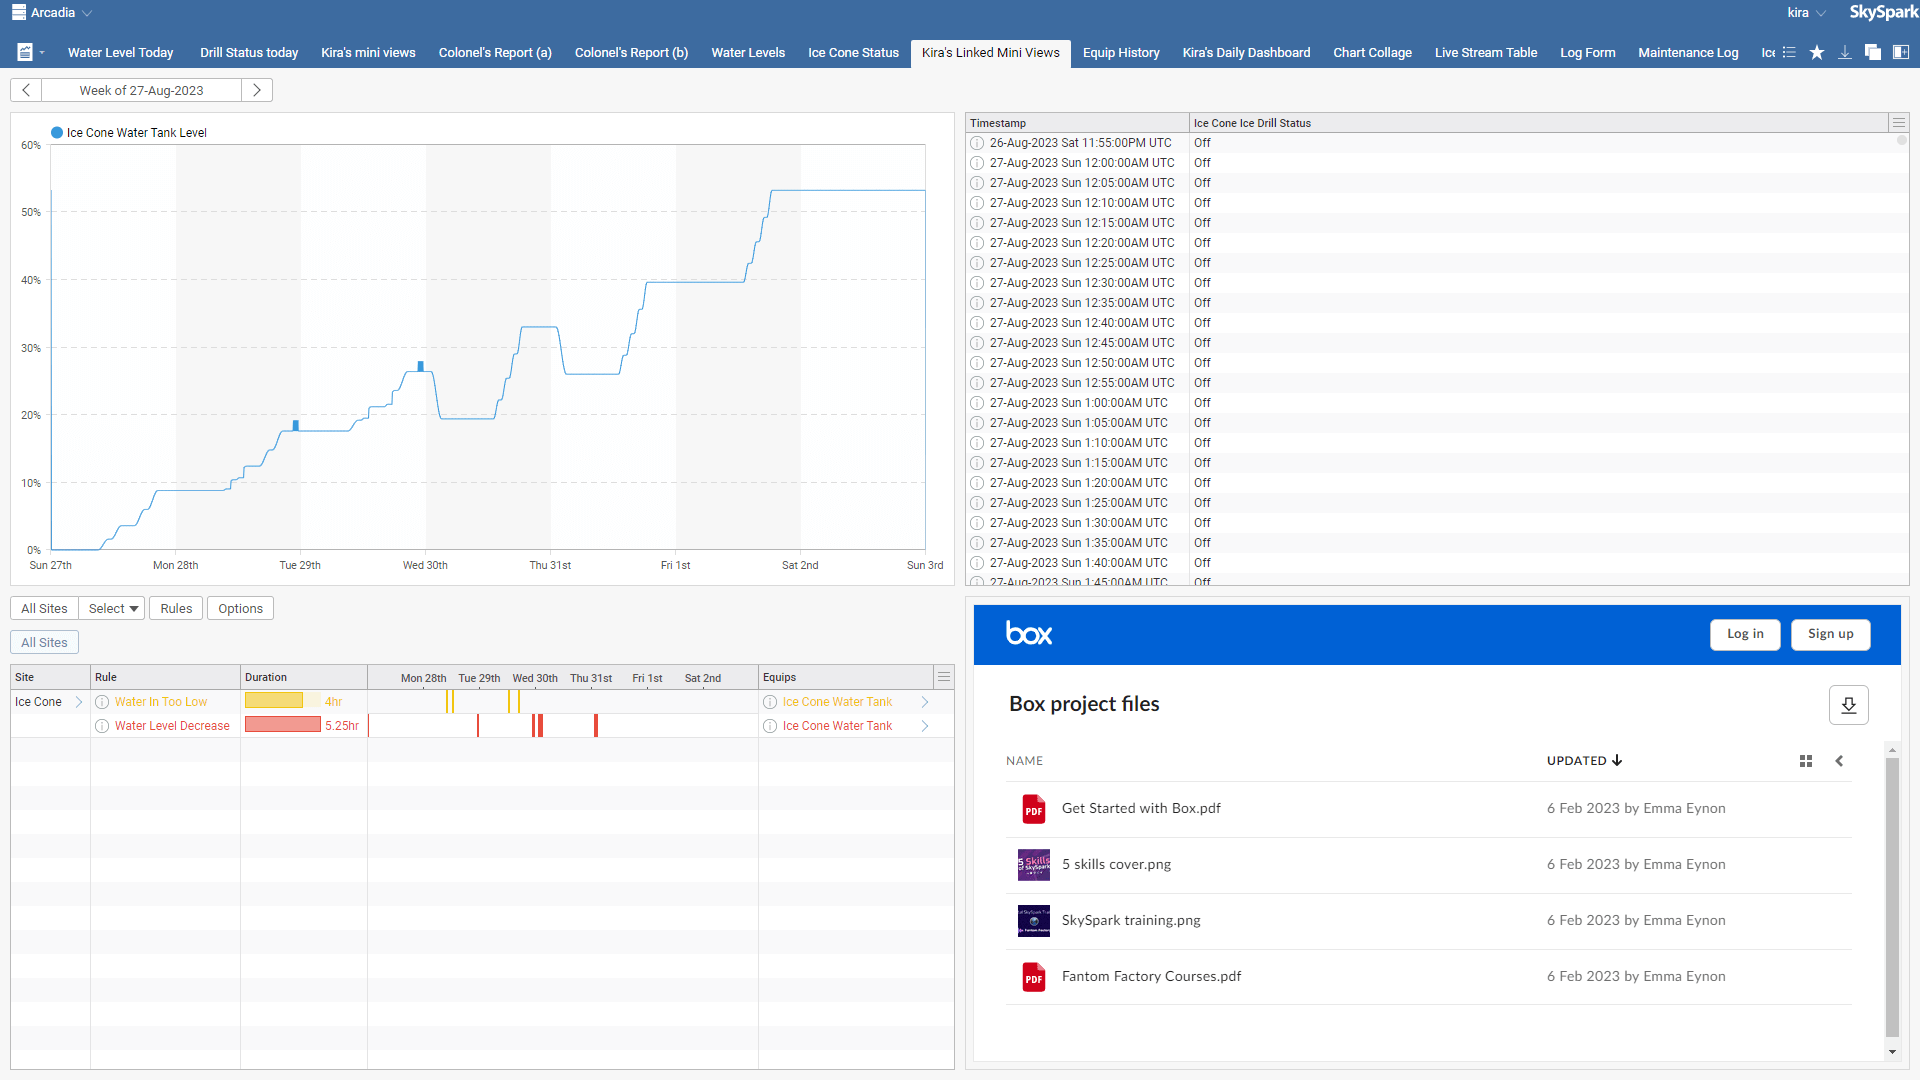
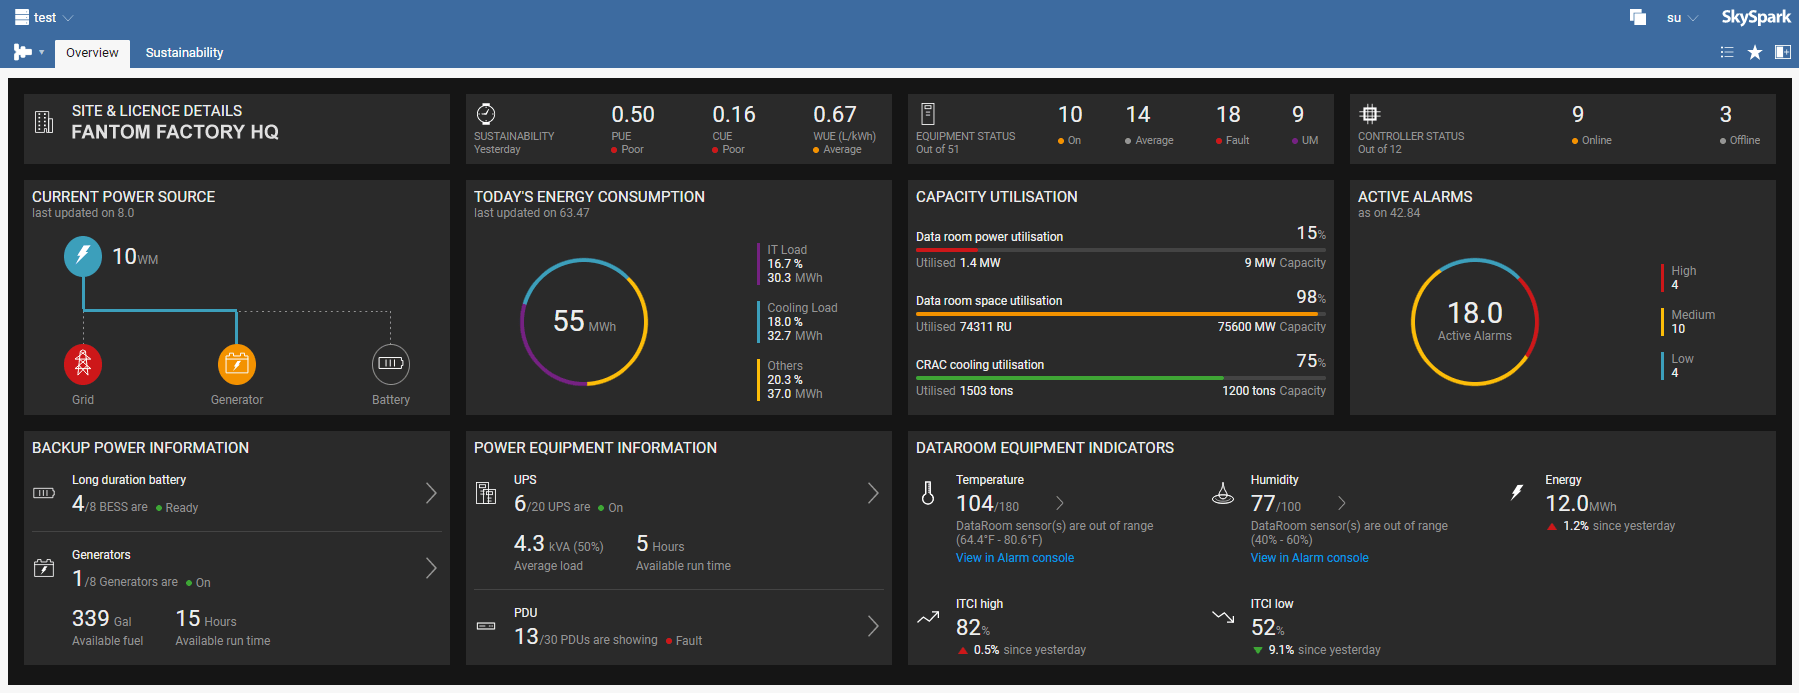
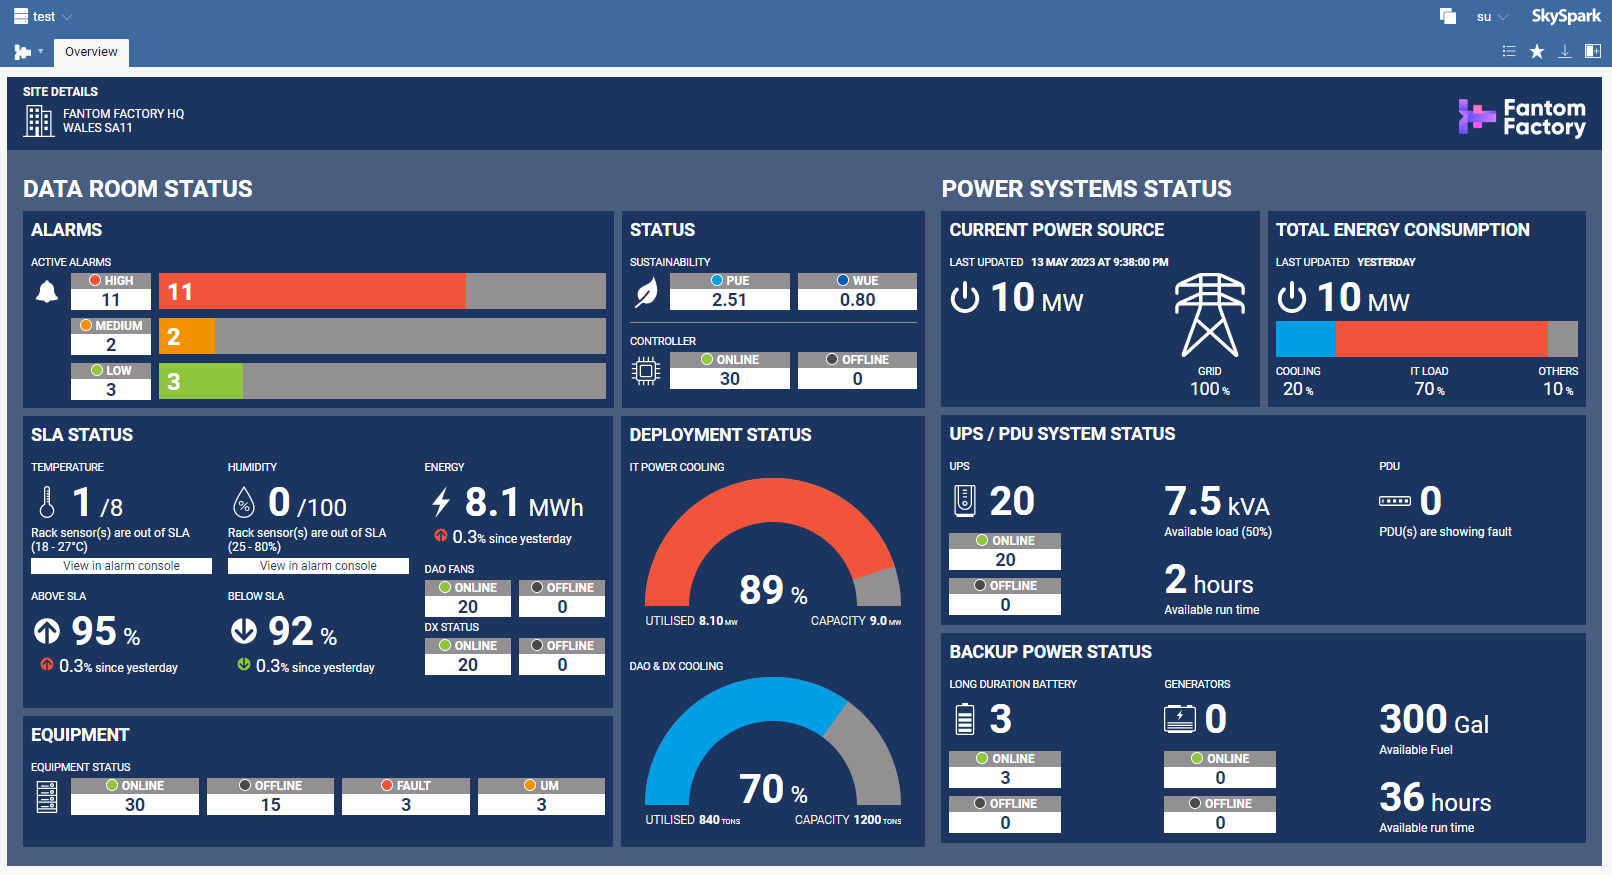
Luxury graphics - with Fantom
When you need high end graphics, you'll need to use the Fantom programming language. SkySpark itself was built in Fantom, so to truly customise your SkySpark instance, you'll need to develop at the platform level.
Sadly there aren't many professionals who can offer this service - but luckily as you read this, you'll realise that Fantom Factory can!
Our Fantom dashboards add a richer layer of graphics and functionality along with a responsive layout. So you can tailor the exact experience you're looking for - inside a SkySpark screen or in a third party application (like Sonrai)!
Watch our dashboard showreel video!

Dashboard considerations
Before you start work on your dashboard project, there are some key points to really consider first. These are the things we've found will save you time and money in the long run.
The purpose
- Internal use only?
- To be sold as a product?
- How many dashboard screens or widgets do you really need?
Sometimes a dashboard which is "designed by committee" can mutate past its original purpose. Make sure that you are making something that will really save you time and effort - not just for the sake of creating something pretty!
Our tip: Start small and basic and grow from there.
The audience
- For stakeholders and clients?
- For engineering teams?
- For domestic users or property landlords?
The experience of using your dashboard needs to be excellent for ALL of your audiences. Remember, the best dashboards give your users EASY follow up actions to take!
You may need to consider different dashboards and options for different audiences if it makes the experience better. You want to spend your effort making something that will get used!
Our tip: Plan out your user journeys to prepare any essential requirements in advance.
Good quality data
As they say often in our neighbourhood, "you can't polish a turd". A dashboard is simply an expedient way of viewing your data. If your data isn't available then your dashboard is...well, useless!
Good quality data is reliable and tagged up correctly. Poor quality data can also be caused by:
- networking infrastructure for data traffic
- SkySpark server performance
- SkySpark data query optimisation
Our tip: Draft a basic dashboard first to test your data feeds.
Fantom Factory support
We continue to work with clients of all organisation sizes around the world on SkySpark development projects. While dashboards are often the end goal we often help with optimising the data quality first, including reviewing SkySpark data queries, Axon functions, and how the data is tagged.
We can help you to gather the best requirements and keep your dashboard project minimal and most effective.
And what's more - we'll have more dashboard information on our website VERY SOON!
Any questions?
Let us know if you'd like to discuss an approach for creating SkySpark dashboards in your business.
 Meme created by Morgan Hesmondhalgh, Fantom Factory!